
A team of five logs two hundred hours in a week. How many of those hours did a client pay for? That share is the utilization rate, and for any business that sells its time it is the number that decides whether a busy month was also a profitable one.
This article gives the formula, a worked example, what the current benchmarks say, where the rest of the hours usually go, and how to measure all of it from the timesheets you already keep.
What utilization rate is
Utilization rate is billable hours as a share of available hours:
Utilization rate = billable hours ÷ available hours × 100
Someone who is available for 40 hours in a week and bills 26 of them has a utilization rate of 65%. The other 14 hours were worked, and paid for by the company, but no client was charged for them.
“Available hours” needs one decision before you start: do you count contracted hours, or contracted hours minus holidays and leave? Either works. What matters is using the same definition every month, or the trend means nothing.
Billable utilization and total utilization
The formula above is billable utilization, and it is what most people mean by the term. Some firms keep a second figure beside it.
- Billable utilization is the hours charged to a client, divided by available hours.
- Total utilization, sometimes called productive utilization, adds agreed internal work to the top of the fraction: training, a company project, a proposal the firm decided to write.
The second figure answers a different question: was this person’s time used on purpose? Someone who spends a week building an internal tool has a billable rate of zero for that week, and may have had the most useful week on the team. If you only track one, track billable utilization, and give internal work named projects so the rest of the week is not a blank.
How to work out available hours
Start from the contract and take off the time nobody could have worked. Here is the sum for one full-time year, with holidays and leave you should replace with your own:
| Step | Hours |
|---|---|
| 52 weeks at 40 hours | 2,080 |
| Less 10 public holidays | − 80 |
| Less 20 days of leave | − 160 |
| Available hours in the year | 1,840 |
| 70% of that, as a billable target | 1,288 |
Those 1,840 hours are 46 working weeks, so a 70% target is 28 billable hours in every one of them. The sum shows why a target that sounds modest as a percentage is still a full week: the other 12 hours have to hold every meeting, every email and every quiet half hour between two tasks.
A worked example
Here is one week for a made-up team of four. The numbers are an illustration, not data.
| Person | Available | Billable | Utilization |
|---|---|---|---|
| Designer | 40 h | 31 h | 78% |
| Developer | 40 h | 29 h | 73% |
| Project manager | 40 h | 18 h | 45% |
| Account lead | 32 h | 10 h | 31% |
| Team | 152 h | 88 h | 58% |
Two things in this table are normal. The roles differ: a project manager and an account lead do work that clients need but rarely see on an invoice, so their rate is lower by design. And the team figure is not the average of the four percentages. It is total billable hours over total available hours, so someone on a short week counts for less.
What a good utilization rate looks like
The most widely quoted yearly figures come from SPI Research’s benchmark of professional services firms. According to Deltek’s summary of the 2026 report, average billable utilization fell to 66.4% in 2025, the lowest level in the survey’s history. The same summary suggests aiming for 70 to 75% or more, “balanced against burnout and quality”.
Read that as a range for people whose main job is client work, not as a target for everyone. A team at 100% has no time left to train, to quote for new work or to fix its own processes, and it has nowhere to put an urgent request. A rate that stays close to 100% for months is usually a warning, not an achievement.
Targets are different for each role
One target for the whole company punishes the people whose job is to keep everyone else billable. Set the target by what the role is for.
| Role | Billable share | Why |
|---|---|---|
| Designers, developers, consultants | Highest | Their work is the thing the client buys |
| Team leads and senior staff | Lower | Reviewing, estimating and mentoring are rarely billed |
| Project and account managers | Lower again | Much of the job is coordination the client never sees on an invoice |
| Owners and directors | Lowest | Selling and running the company come first |
Whatever numbers you choose, write them down beside the definition of available hours, and compare each person with their own target, not with the person at the next desk.
Where the other hours go
The hours that are not billed are not wasted by definition. They fall into a few groups, and the point of measuring is to see which group is growing.
- Running the business. Internal meetings, hiring, admin and timesheets themselves.
- Winning work. Proposals, pitches and estimates.
- Getting better. Training and learning a new tool.
- Work that should have been billed. Overruns on a fixed price, changes nobody quoted for, and rework. This is the group worth chasing first.
- Time lost between tasks. Gloria Mark, who studies attention at the University of California, Irvine, found that people working on screens spend about ten and a half minutes on a project before switching, and need about twenty-five and a half minutes to get back to one that was interrupted. Her figures come from watching people at work, and they explain why a day of eight hours can hold far fewer hours of finished work.
How to measure it from your timesheets
- Mark every entry as billable or not. Set it on the project so nobody has to think about it for each entry.
- Give internal work its own projects. “Admin”, “Sales” and “Training” are enough to start. Non-billable time with no project tells you nothing.
- Decide what available hours means and write it down.
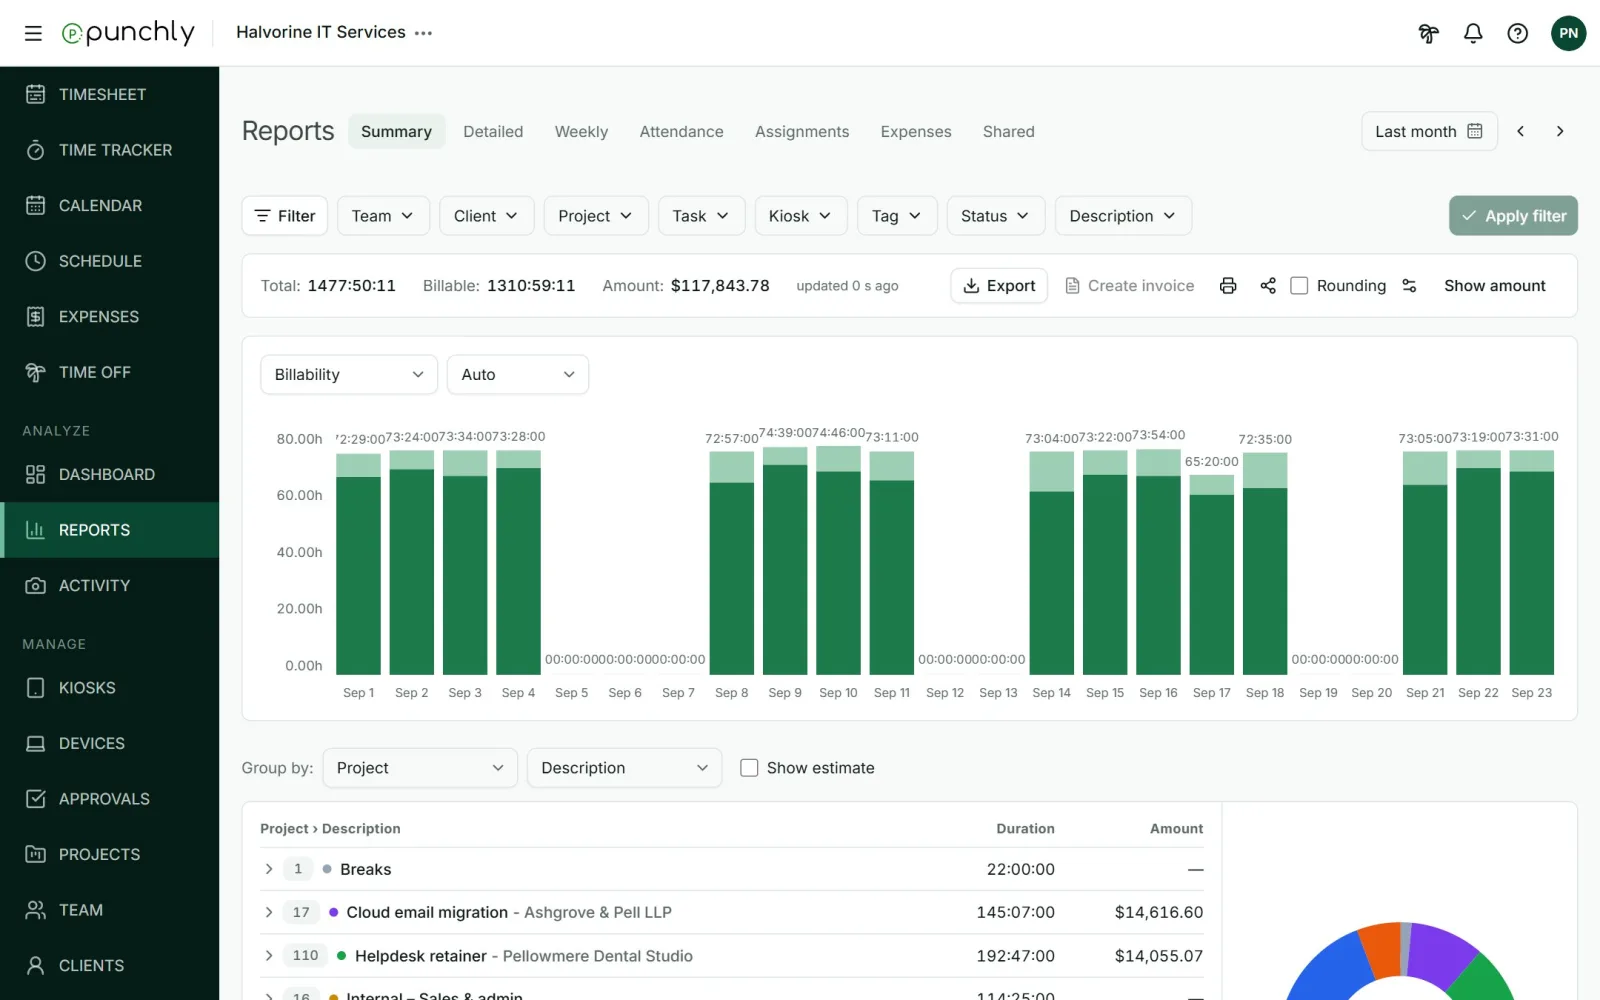
- Run one report a week, grouped by person, with billable time beside total time.
- Judge a month, not a day. One slow Tuesday is noise. Four weeks is a pattern.
What to do with the number
If the rate is lower than you expected, look at which non-billable project grew. Meetings and overruns are the usual answers, and each has a plain fix: fewer standing meetings, and a rule that changes to the scope are quoted before they are started.
If the rate is very high, check overtime and leave before you celebrate. And do not rank people by utilization alone. It measures how time was sold, not how well the work was done, and a team that is paid on it will learn to log everything as billable.
Mistakes that make the number wrong
- Changing the definition. Counting leave as available one month and not the next moves the rate by several points with no change in the work.
- Logging everything as billable. If non-billable time is frowned on, it stops being recorded, and the rate rises while the invoices do not.
- Stopping at hours. Hours that were billable but written off before the invoice went out still count as utilized. Check them against what was invoiced.
- Comparing roles. A project manager at 45% and a developer at 75% may both be exactly on target.
- Reading one week. A holiday, a pitch or a quiet client can move a single week by twenty points.
How to raise it without burning people out
- Plan the week before it starts. Gaps between projects are cheaper to fill on Thursday than to discover the following Friday.
- Put meetings together. Three meetings spread through a day leave four pieces of time too short to start anything in.
- Quote changes before doing them. Most unbilled overrun starts as a small favor.
- Move admin to fewer hands. Ten people doing a little invoicing each costs more than one person doing all of it.
- Give the gaps a purpose. A planned internal project is better than an afternoon that is lost one message at a time.
How Punchly shows it
Punchly is time tracking software, so here is plainly what it gives you for this, and on which plan.
| What you need | In Punchly | Plan |
|---|---|---|
| Billable or not, for each entry | A billable switch on every entry, with a default set on the project | Free |
| Billable time beside total time | The Summary report shows total time and billable time, and can group by person or by billable | Free, for 31 days at a time |
| The percentage at a glance | The dashboard has a Billability view with the billable percentage | Free |
| What the hours earned | Billable rates turn hours into amounts | Basic |
| Cost and profit | Cost rates add what each hour costs you | Pro |
| Hours against capacity | Scheduling plans work against each person’s capacity | Pro |
Punchly does not calculate a utilization rate against contracted hours for you. It gives you billable and total time for any period, and the dashboard percentage is billable time over tracked time.
Questions people ask
Punchly is free for teams of up to 5. Every new workspace gets 7 days of the Pro features, with no credit card.