
Dashboard
The Dashboard is the quick picture: how much time was tracked, on which projects, and what the team worked on last. It is the first place to look before opening a full report.
Where
Dashboard, in the Analyze group
Who
Everyone for their own time. Team view for managers and admins
Plan
Free
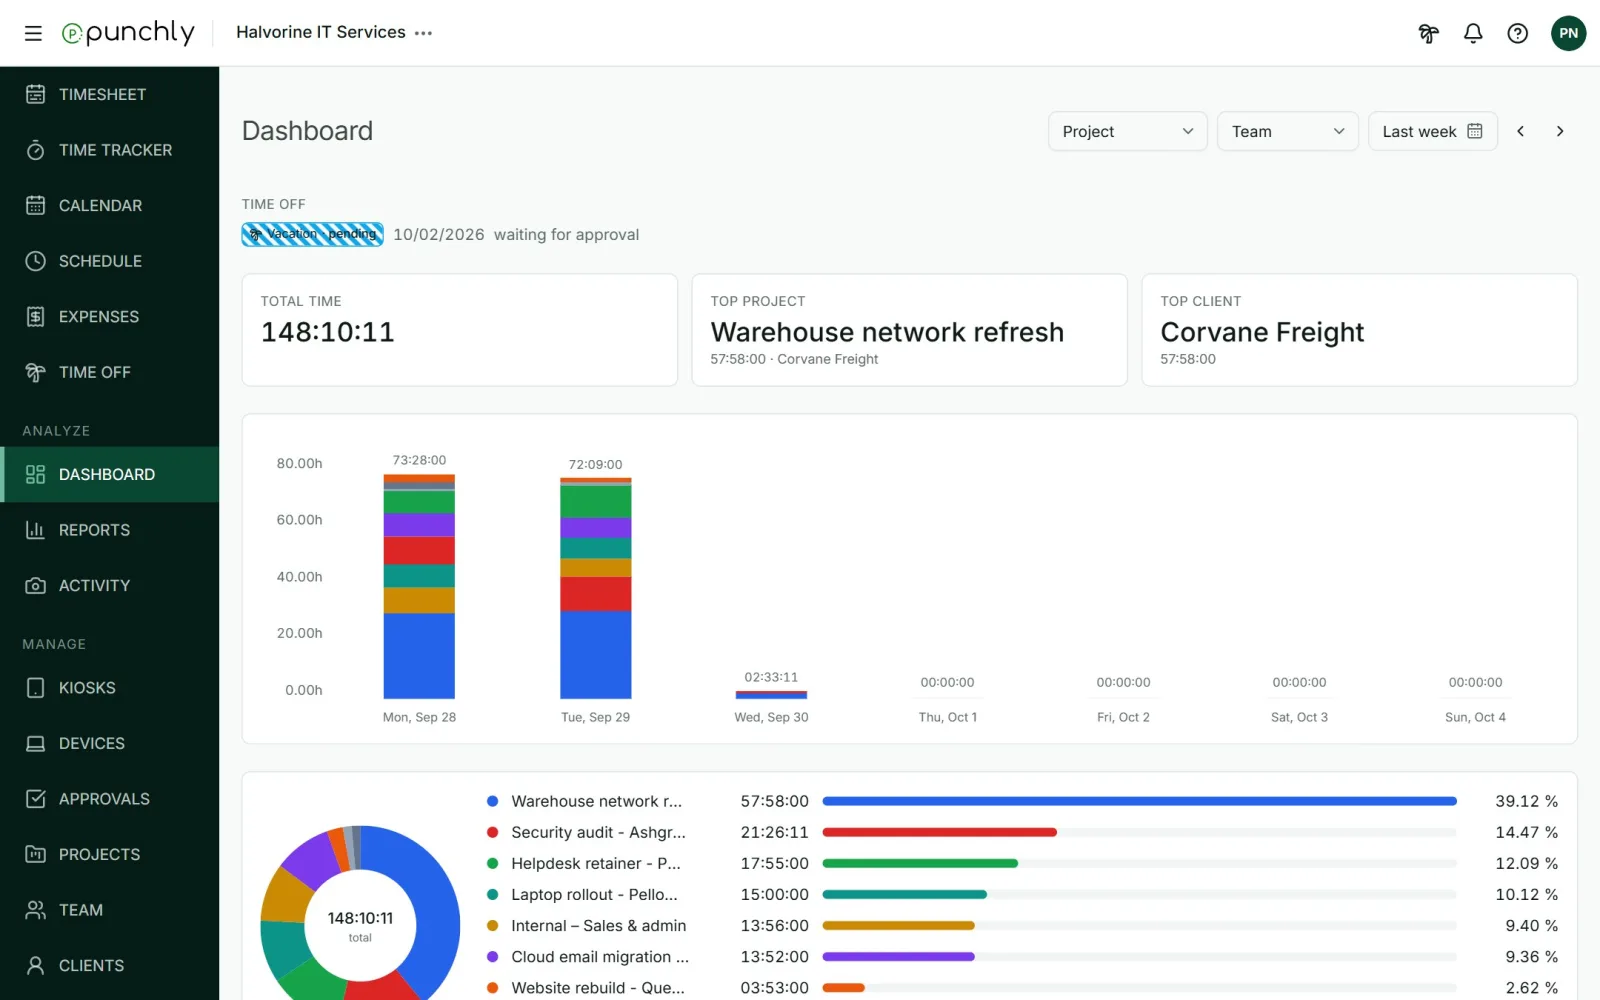
The three choices at the top
- Chart type: Project, or Billability to see billable against non-billable time.
- Only me or Team: your own time, or everyone you are allowed to see.
- Date range: This week to start with. See How reports work for the choices.
What is on the screen
- Total time for the range.
- Top project and Top client. With chart type Billability, these become Amount and the Billable percentage.
- A bar per day, coloured by project or by billable and non-billable.
- A donut and a list with each project’s share of the time.
- Most tracked activities (Only me): what you spent the most time on.
- Team activities (Team): each person’s latest activity and their total for the range.
Good to know
- A running timer does not show yet. Latest activity is the last entry a person finished, and totals count finished time only.
- Team view for regular members is available only if the workspace switches it on.
- Amounts are shown only to people allowed to see rates and amounts. Others see a dash.
- The dashboard never rounds time.
- The address in the browser holds the whole view, so a copied link opens the same picture.