
Summary report
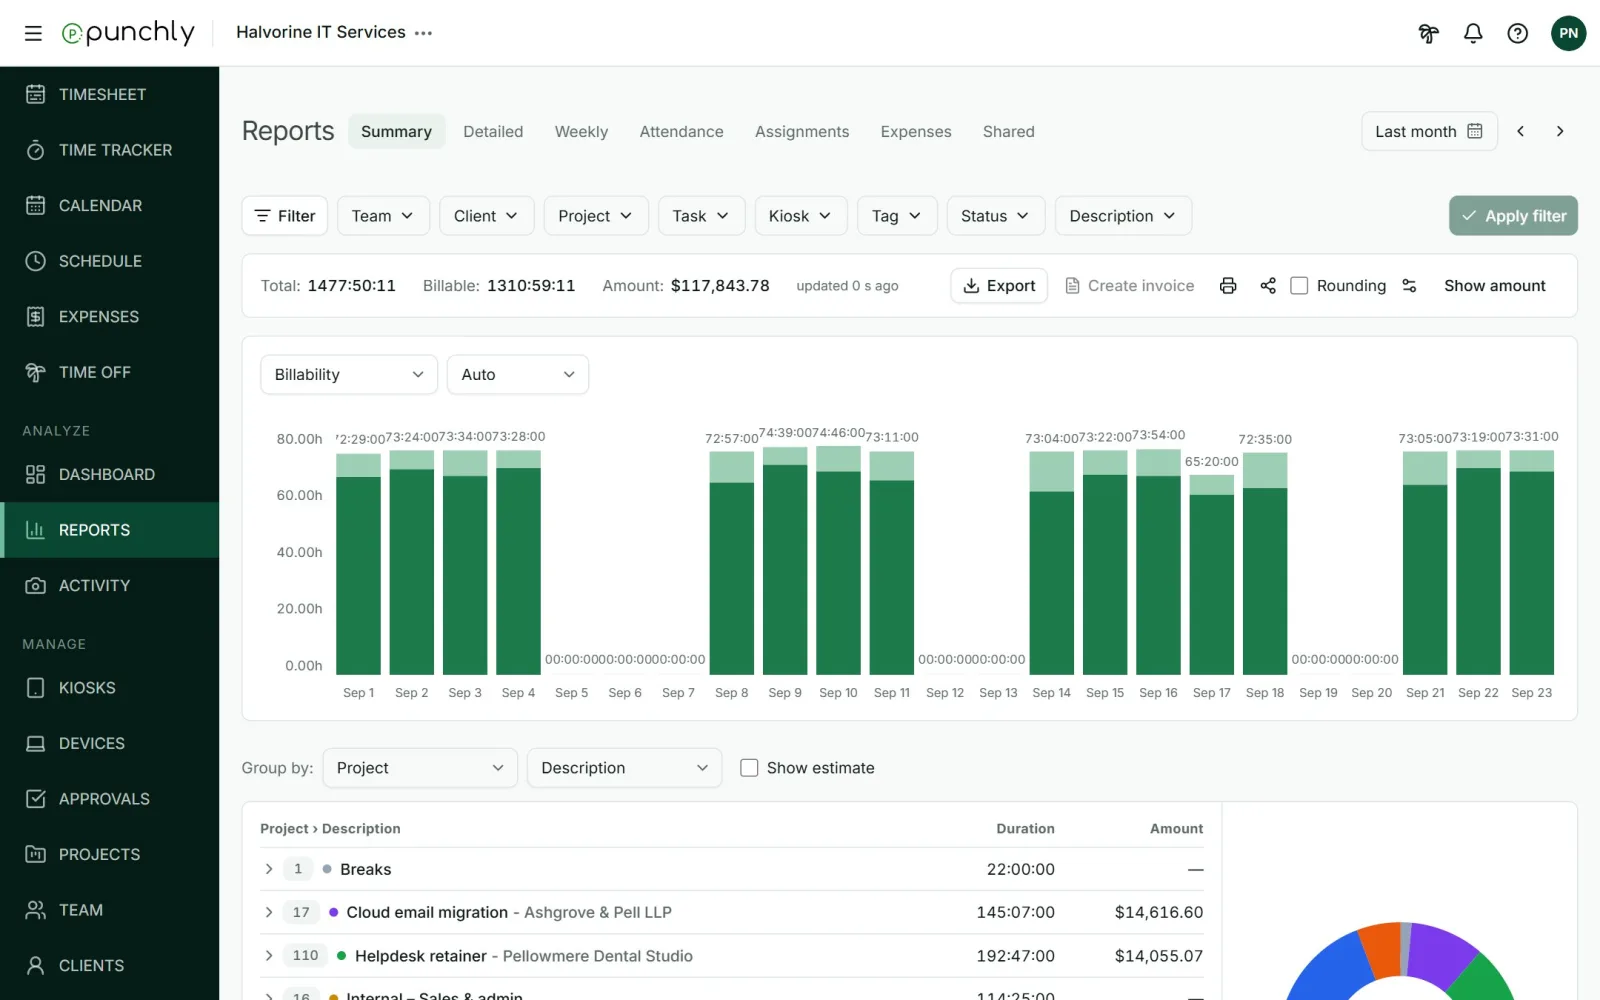
The Summary report adds time up and groups it. It answers questions like “how many hours did each project take last month?” or “who worked on what for this client?”
Where
Reports, Summary tab
Plan
Free
Group the time
Use Group by to choose up to three levels. It starts as Project, then Description.
- You can group by Project, Client, User, Group, Tag, Task, Description, Billable, Month, Week or Date.
- Click a row to open the level beneath it.
- Click a column heading to sort.
Examples: Client then Project for a client overview. User then Project to see what each person worked on. Project then User to see who worked on each project.
The chart
The bar chart shows time across the range, split by billability or by project. Bars are days for short ranges, then weeks, then months. You can also set this yourself.
The totals line
Above the chart: Total time, Billable time, and Amount, Cost and Profit if you chose to show them.